Introduction
Process Monitor (prmon) is a standalone, non-Athena-specific, open-source tool.
It historically originates from Athena-specific MemoryMonitor and was developed and maintained under the HEP Software Foundation. prmon provides a process/device-level resource usage information. One of its most useful features is to use smaps to correctly calculate the Proportional Set Size in the group of processes monitored, which is a much better indication of the true memory consumption of a group of processes where children share many pages.
prmon currently runs on Linux machines as it requires access to the /proc interface to a process statistics.
Using prmon
On CERN machines, it can be setup with lsetup or any Athena releases that are older than R22.
The prmon monitor a specific process and its children in the same process tree. The simplest way to run it is prmon --pid PPP or prmon -- athena.py arg .... The whole whole set of arguments you can find here
After prmon is done it produces the output in the prmon.txt that can be analyzed with the prmon plot script, for instance:
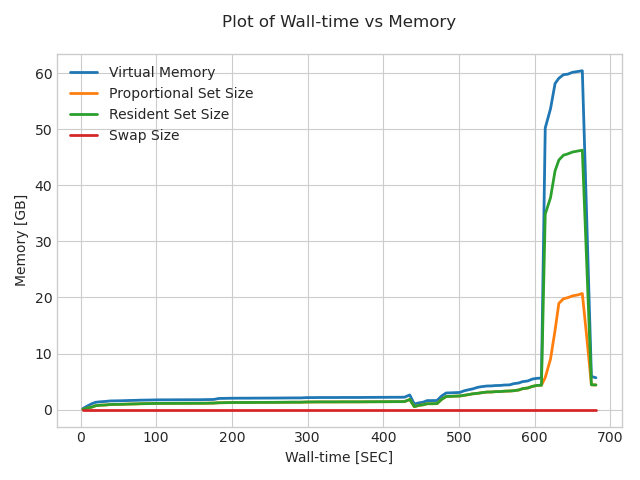
prmon_plot.py --input prmon.txt --xvar wtime --yvar vmem,pss,rss,swap --yunit GB --xunit MIN
produces memory metrics vs wall time:
To see all the options use prmon_plot.py --help.
The transform jobs automatically launch prmon and produce the prmon.full.jobname, prmon.summary.Derivation.json and prmon.log files. The prmon.log is log messages, the other two will be explained below.
Understanding the prmon output
The prmon.txt or prmon.full.jobname output files contain snapshot statistics are written every 30 seconds, another interval could be specified as with the --interval option:
To understand better the output one can check the proc documentation
In addition, the prmon produces json summary with the average and maximum of all metrics:
{
  "Avg": {
    "nprocs": 3.0,
    "nthreads": 3.0,
    "pss": 3057375.0,
    "rchar": 128945397.0,
    "read_bytes": 0.0,
    "rss": 3257022.0,
    "rx_bytes": 962101.0,
    "rx_packets": 1100.0,
    "swap": 0.0,
    "tx_bytes": 482533.0,
    "tx_packets": 1486.0,
    "vmem": 4283525.0,
    "wchar": 959820.0,
    "write_bytes": 866408.0
  },
  "HW": {
    "cpu": {
      "CPUs": 64,
      "CoresPerSocket": 16,
      "ModelName": "AMD EPYC 7302 16-Core Processor",
      "Sockets": 2,
      "ThreadsPerCore": 2
    },
    "mem": {
      "MemTotal": 263439672
    }
  },
  "Max": {
    "nprocs": 3,
    "nthreads": 3,
    "pss": 3555231,
    "rchar": 760777844,
    "read_bytes": 0,
    "rss": 3791416,
    "rx_bytes": 5676400,
    "rx_packets": 6494,
    "stime": 8,
    "swap": 0,
    "tx_bytes": 2846948,
    "tx_packets": 8769,
    "utime": 574,
    "vmem": 4779428,
    "wchar": 5662940,
    "write_bytes": 5111808,
    "wtime": 590
  },
  "prmon": {
    "Version": "3.0.1"
  }
}
prmon results for grid jobs
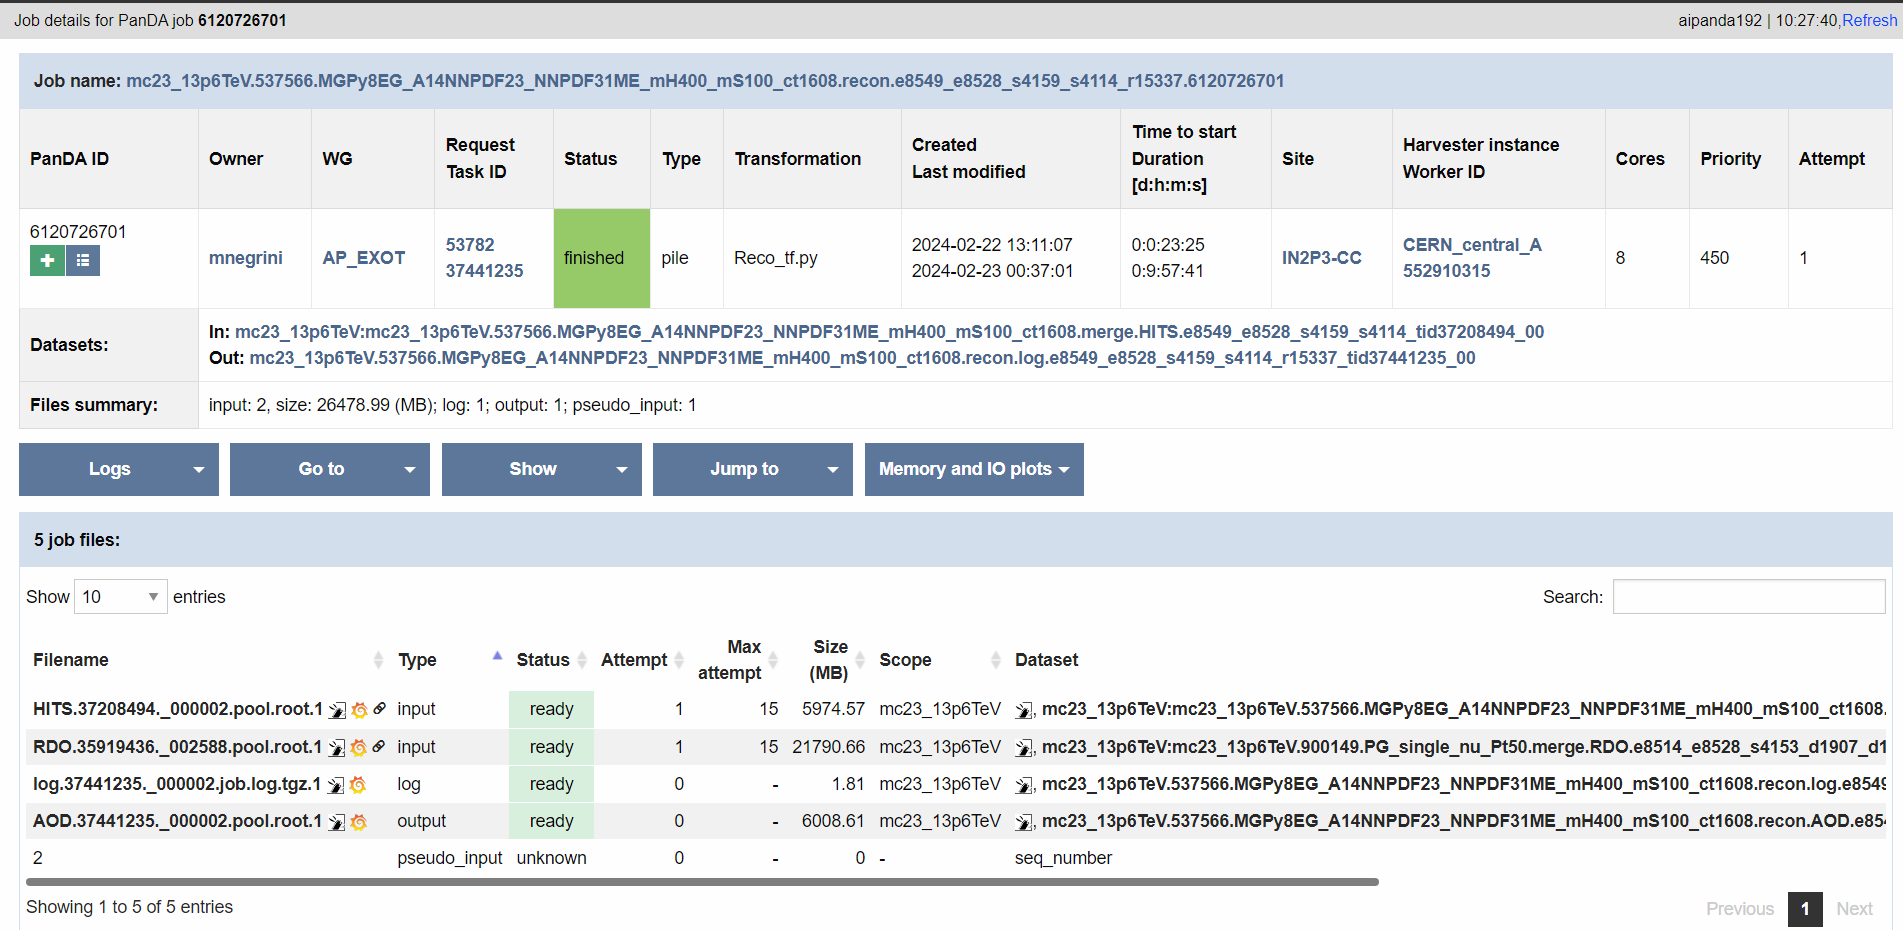
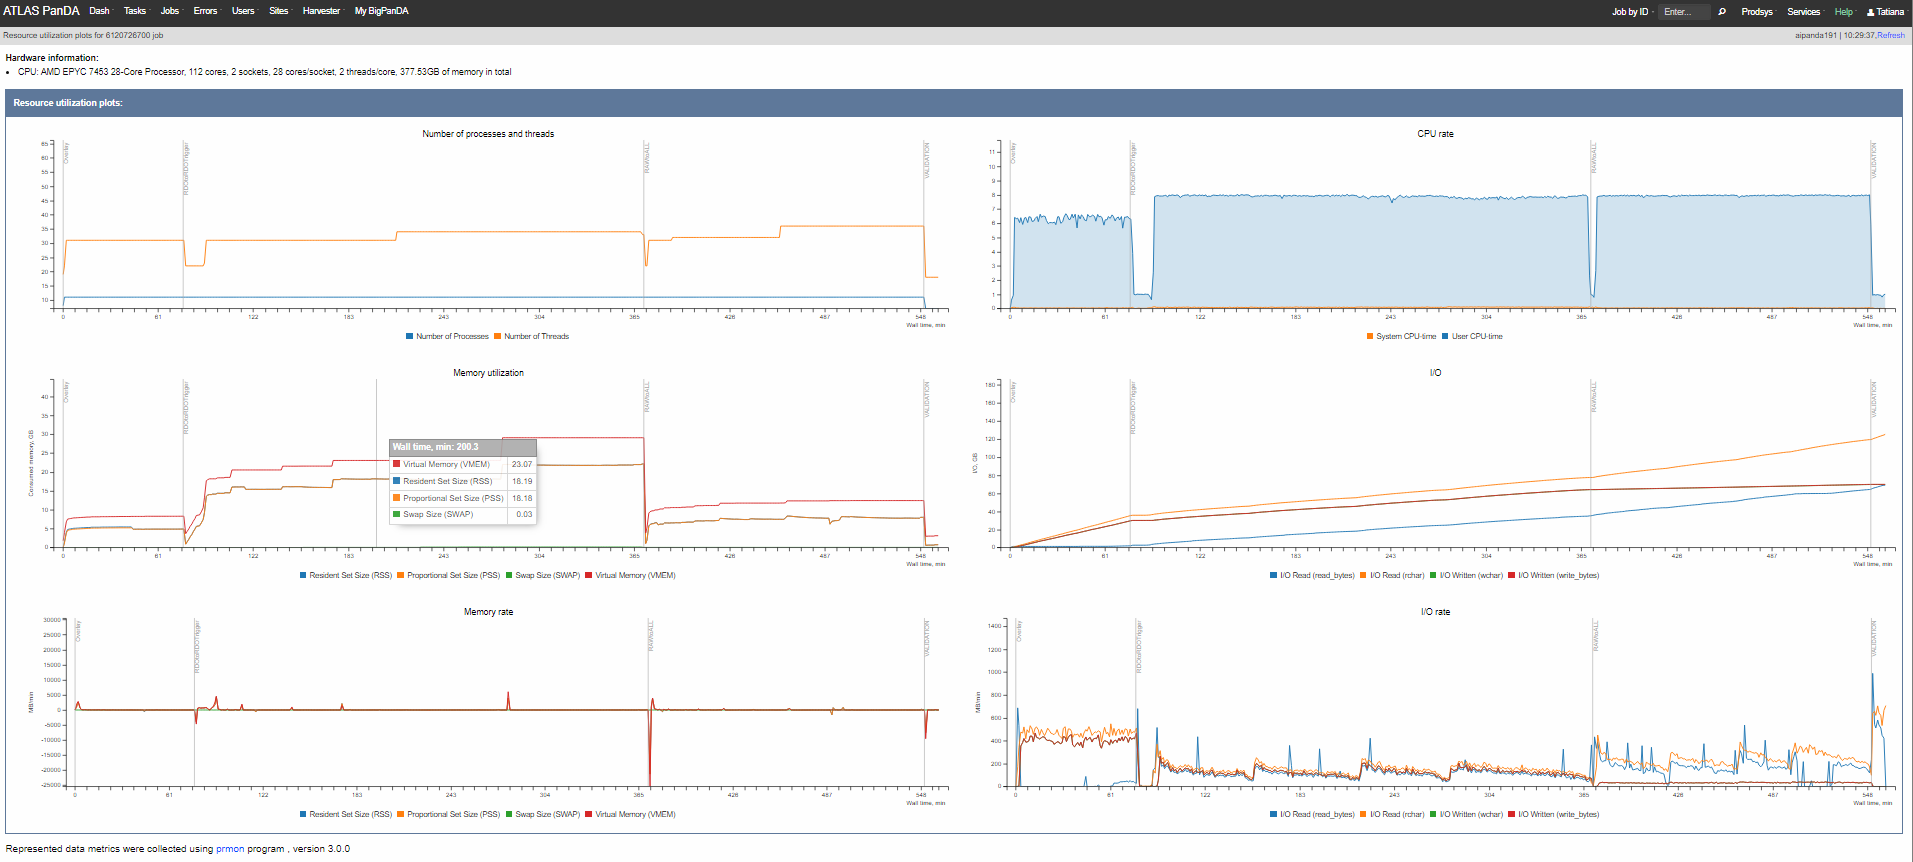
You can also check the prmon plots for the production jobs using the ATLAS panDA interface:


