During data taking ATLAS sees a bunch crossing event every 25 ns, i.e., sees collisions (referred to as events) at an average rate of 40 MHz. That is far more events than we could read out from the detector, store to disk, or reasonable process afterwards. Luckily for the typical physics analysis, we are only interested in a small subset of the data, so we use a trigger system that selects those events that are interesting for physics analysis, and only those are stored to disk.
The ATLAS experiment has a two-level trigger system, consisting of the Level-1 Trigger (L1) and the High-Level Trigger (HLT). L1 gets only limited data from the detector systems, but can process all input events (i.e., every 25 ns). L1 runs very simple algorithms in FPGA hardware in about 2 microseconds, with an output rate of about 100 kHz. When an event is accepted by L1, it is moved from event buffers in the detector electronics to temporary storage space in the HLT computing farm. HLT has access to the full detector information and can run a simplified version of the full event reconstruction algorithms. HLT has an output rate of about 3.5 kHz and all events accepted by the HLT are sent to permanent storage.
There are two reasons why you may have to worry about triggers in your analysis:
-
The algorithms, corrections, and calibrations used by the triggers are different from the versions you use in analysis. This means the trigger selection may miss some events that your analysis selection would have picked up, even if the trigger nominally has a “looser” selection. If that happens, your analysis will have to account for that.
-
Your analysis may want to use events that the trigger isn’t even designed to select in the first place. In that case your analysis group will have to work with the trigger group to add your analysis signature to the trigger, so events you care about will be recorded in the future.
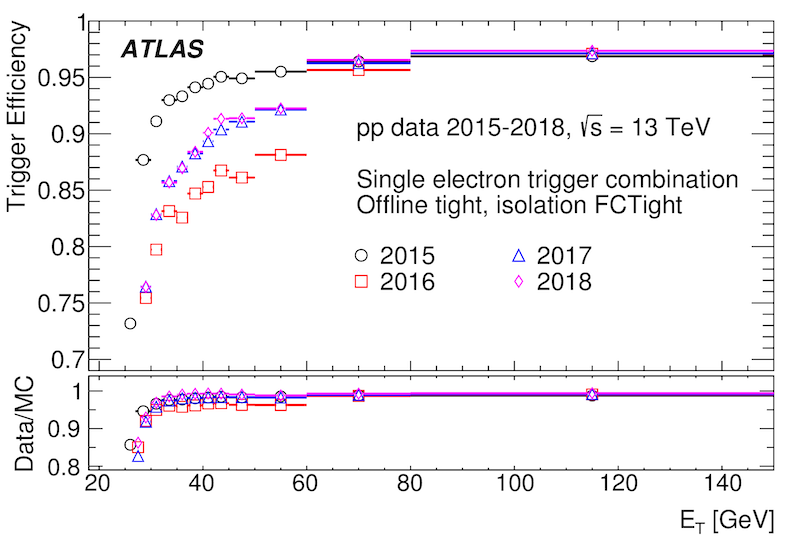
There are two key figures of merit that characterize the performance of triggers: the rate and efficiency of each trigger. Much like for lepton identification, the efficiency can be improved, but usually at the cost of a higher rate. Separate rates and efficiencies apply for the L1 and HLT components of each trigger. The figure below shows the efficiency for the single electron trigger as a function of the electron ET. The efficiency is the fraction of events in each bin of ET that are selected by the trigger.

What do you think happened between 2015, 2016, and 2017 to change the efficiency of the trigger the way you see in the plot?
Often analyses have to account for differences between the real data trigger and the trigger in the MC simulation through “scale factors”. These scale factors can be a bit tricky, as they require you to look at the object(s) (lepton, jet, etc) that was selected by the trigger, which might not be the one(s) your analysis is otherwise using.
Often triggers are limited by the efficiency at L1. For that reason, ATLAS significantly upgraded its L1 trigger system during the last long shutdown.
Trigger Menu
A single step of trigger selection is called an “item”. A combination of items
is called a “chain”, though the chain is often referred to as “a trigger”. An
L1 trigger might be a single step, and so a single item (often called a “seed”).
Almost all HLT triggers are sequences, and so are themselves chains. For
example, the single electron trigger in 2018 was HLT_e26_lhtight_nod0_ivarloose.
This trigger has an ET threshold of 26 GeV, applies likelihood
tight ID for each electron, has no impact parameter (d0) requirement and
requires loose, variable threshold isolation. The chain runs on on events that
are first selected in the L1 trigger by the L1 item L1EM22VHI. In some trigger
chains, the L1 trigger item is written explicitly. For others, you might have to
look it up. More details on the trigger naming scheme can be found on the
TriggerNamingRun3 twiki page.
When ATLAS runs, we define a “menu” of chains. There are often hundreds of individual chains running at any given time. The full trigger menu includes both triggers with a prescale of 1 (where every event is accepted) and triggers that are prescaled. A trigger with a prescale of 10 will accept 1 out of every 10 events. Prescales can be used separately at L1 and the HLT and can vary from run to run, as well as within a single run.
The majority of physics analyses use triggers that are unprescaled. You can find a full list of unprescaled triggers on the LowestUnprescaled twiki page.
Although most analyses use unprescaled triggers for the main signal regions, many analyses also make use of prescaled triggers for control and validation regions.
Keep in mind that the methods used in the trigger make approximations to save
time – therefore the thresholds do not necessarily match the same threshold
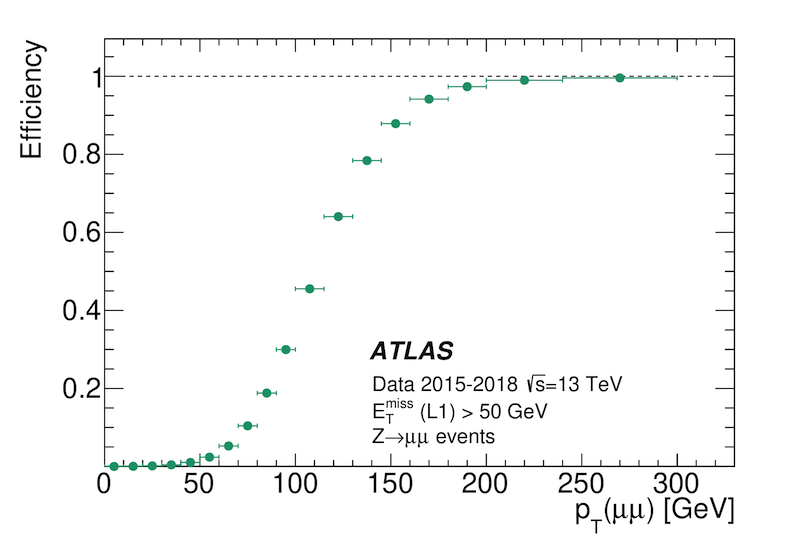
offline. Take missing transverse momentum (MET) as an illustrative example (which
is probably the most extreme case). The unprescaled item in Run 2 was L1_XE50.
The efficiency curve shown in the figure below does not reach 85% efficiency until
the offline MET value reaches around 150 GeV. These differences have to do with
all of the approximations and calibration effects that differ between offline and
the trigger.

You can read more about the trigger menu in each year in these references:
Trigger decision
In your analysis, you need to ensure that you select events that were selected by a specific trigger (or list of triggers). To do this, you need to access the trigger decision via the trigger decision tool, which we will walk you through in the example in the next section.